My softwares for statistical phylogeography
You know, when I’m not doodling or coding, I’m something of a scientist myself… :trollface:
![]() Long time ago I went to a landscaping school to be a gardener
Long time ago I went to a landscaping school to be a gardener ![]()
![]()
![]()
But, as it appeared later,
landscaping was much more about the mechanic of wooden materials or
the exact grocery list of what a lettuce eats in a day than just about planting flowers,
helping seeds grow and making our French landscapes green again.
Plus, I had no idea what to plant that could withstand climate change projections for 2050 anyway ![]()
So, in the middle of an Irish farm field somewhere between Kilkennny and Waterford, looking at a starflower and surrounded by 300 chickens, I decided I was done with practical applications of agro-ecological concepts, and I went to study the theoretical stuff in Bordeaux, Salamanca, Montpellier, Paris and finally … ze Michigan!
But landscaping never really left me ![]()
Today, spatiality (that is, the effects of space on processes, interactions, organisms and theories) can be found at every level of my work. From the most conceptual questions to the statistical methods, and even in some of the most intricate (and, let’s face it, obscure) lines of code I write. Let me show you how.
My discipline - Statistical Phylogeography
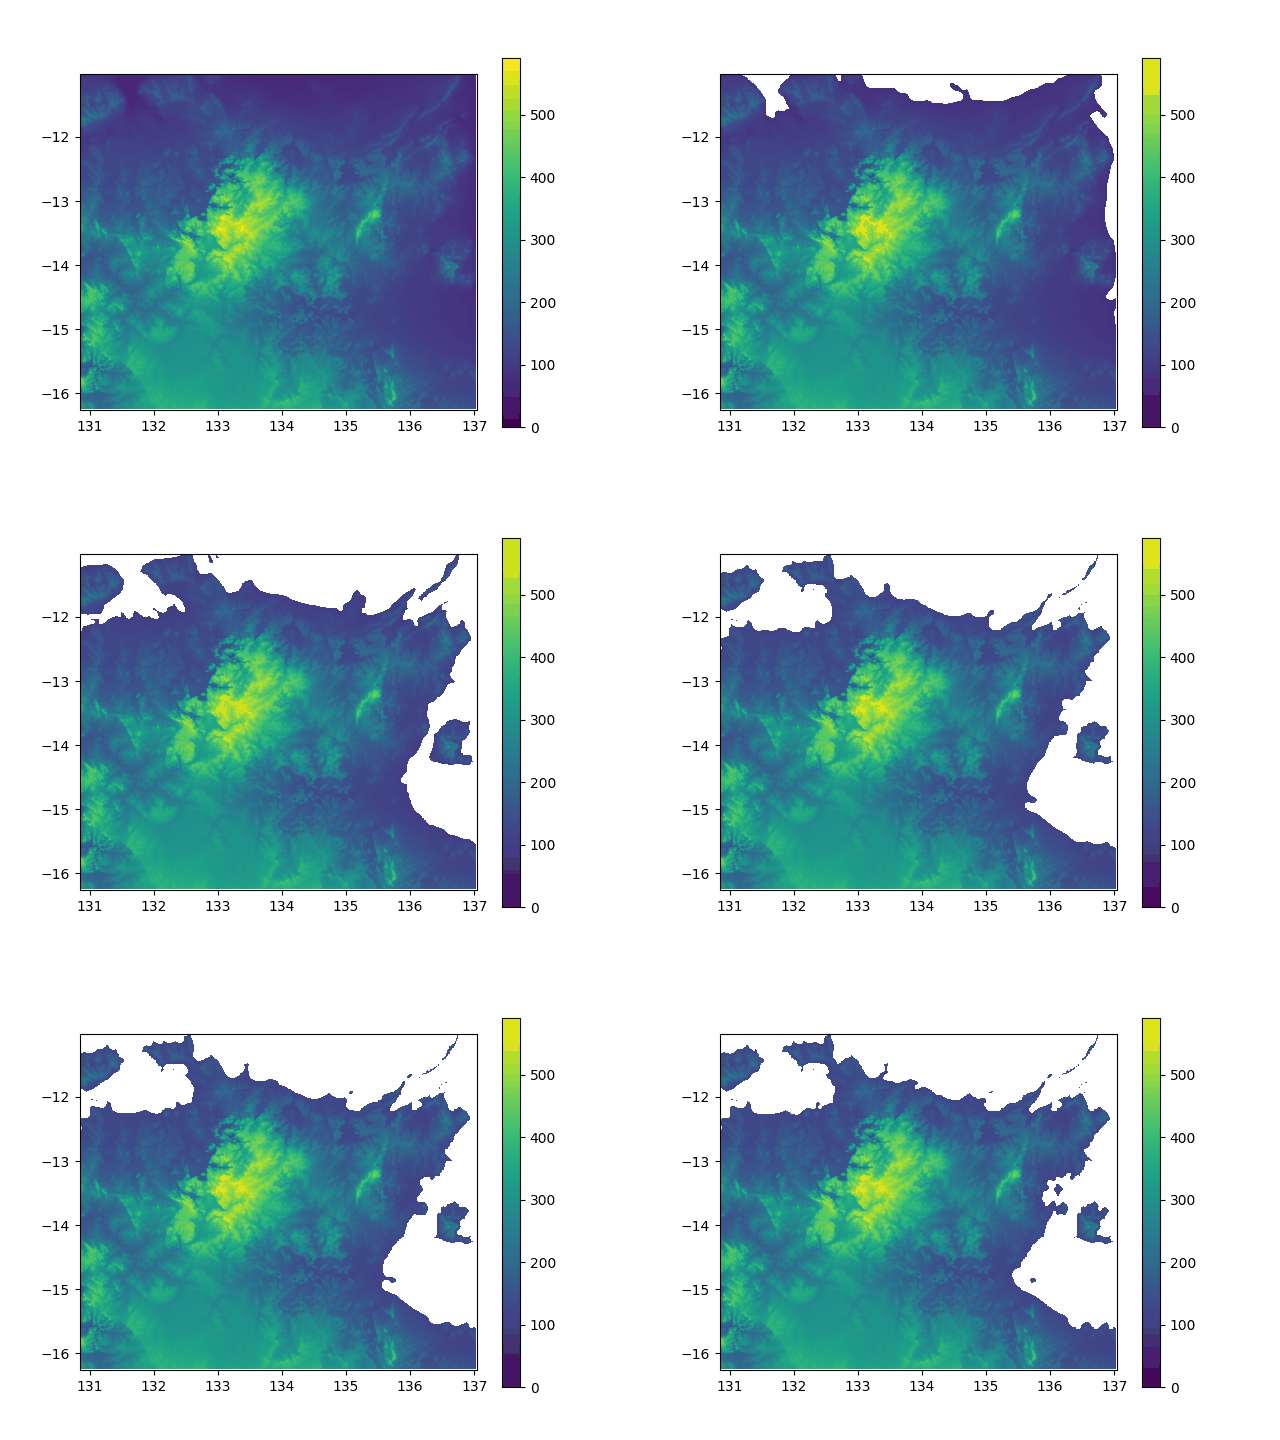
Elevation above sea level in North Australia, from -5000y to today. If you think this did not impact the lifestyle of my lil insular geckos ![]() , well... prove it with stats!
, well... prove it with stats!
Animated with Quetzal-CRUMBS
![]() For a more formal introduction, check this cool review by L. L. Knowles (2009).
For a more formal introduction, check this cool review by L. L. Knowles (2009).
My research is rooted in phylogeography, the study of how past processes have shaped the present spatial distribution of genetic lineages (within and among closely related species).
By past processes, I mean historical or geological events, such as:
-
 Artificial dispersal of species - non-indigenous, naturalised or invasive
-
 Sea level change - important for archipelagos diversity
-
 Dynamics of glaciers - impacting alpine plants that live on their moving margins
-
 Climatic pulses - see e.g. the campos rupestres, Brazilian sky-islands
![]() If I can come with a bunch of models that can generate lineages under some versions of these scenarios, then I can compare them to the observed lineages in a statistical framework, and objectively decide what model is the best supported (that is, what historical scenario has the most likely happened to my data).
If I can come with a bunch of models that can generate lineages under some versions of these scenarios, then I can compare them to the observed lineages in a statistical framework, and objectively decide what model is the best supported (that is, what historical scenario has the most likely happened to my data).
Often I don’t know some details of these models with precision and so I try to estimate them in a Bayesian framework. When working with complex landscapes there is not much you can mathematically do, so I use simulation-based inference methods.
These questions are of fundamental, sometimes urging, importance. For example, campos rupestres represent 1% of Brazil’s surface, but host 15% of Brazil’s plants diversity! And about 70% of all species in the Velloziaceae and Eriocaulaceae families!
But global warming threatens these sky-islands: understanding the past could help us know if or how these species will survive the next century!
My field - iDDC modeling
![]() This term was coined in 2013 by Qixin He to differentiate this line of work from previous spatially explicit methods that did not integrate species distribution models.
For a great review of iDDC modeling, go read this article by Dennis J. Larsson, Da Pan and Gerald M. Schneeweiss!
This term was coined in 2013 by Qixin He to differentiate this line of work from previous spatially explicit methods that did not integrate species distribution models.
For a great review of iDDC modeling, go read this article by Dennis J. Larsson, Da Pan and Gerald M. Schneeweiss!
 - I liiike … I-ntegrated!
Fundamentally, iDDC modeling recycles some of the best spatial methods in Ecology and Evolution, and blends them into an approach that can keep up with the intimidating scales and inferential challenges of phylogeogaphic questions. The not-so-secret ingredients of the iDDC recipe are unveiled by its name:
- Integrated
- Distributional
- Demographic and
- Coalescence modeling.
 - D liiike … Environmental Niche Modeling! Wait a minute
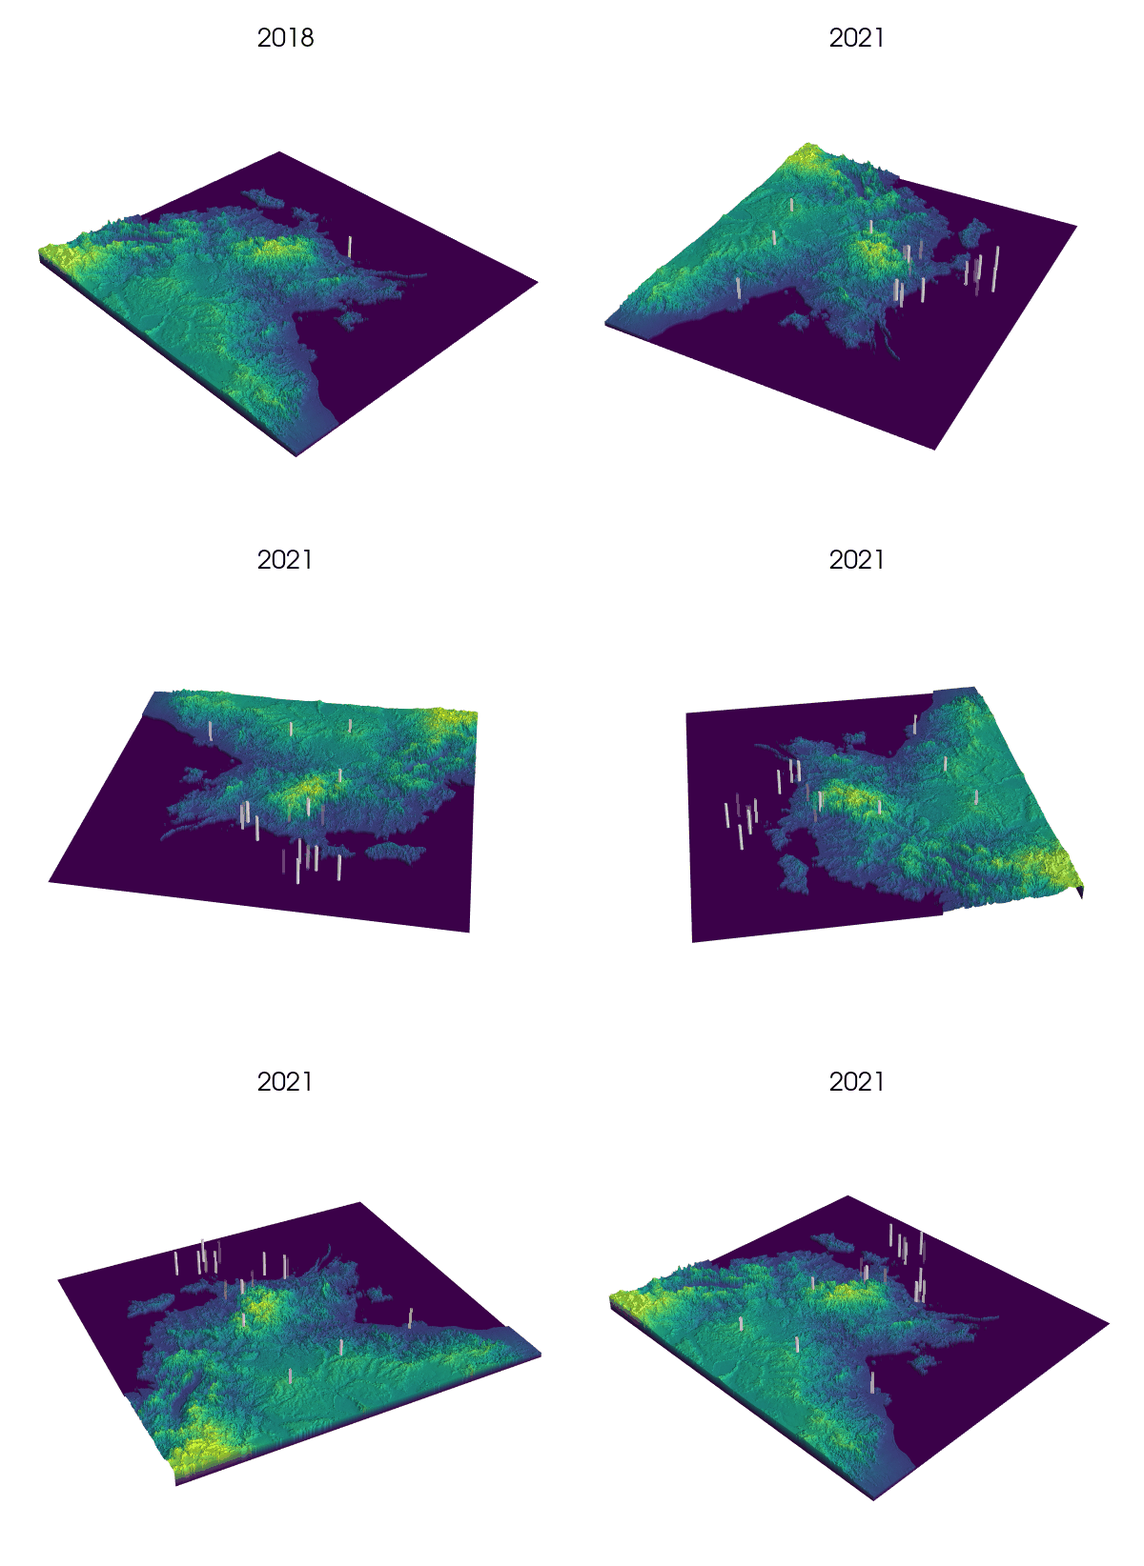
Observational data: a key step for SDMs.
Simulated and animated with Quetzal-CRUMBS
Indeed! Environmental Niche models (ENMs) also go by the sweet name of Species Distribution Models (SDMs).
These models use presence/absence data of a species to draw correlations between longitude, latitude and the value of some environmental variables at these locations. The end result generally consists of some prediction of the habitat suitability over the landscape.
I use these suitability maps to inform parameters of my demographic models. I can for example decide that the growth rate will be twice the suitability, and the carrying capacity ten times the suitability. I could actually chose any other arbitrary function.
This is super important for several reasons:
- It decreases the number of parameters in my models by several orders of magnitude.
For example, instead of having 100.000 parameters (1 for each of your 100.000 demes) there is only 1 parameter for the whole landscape, rescaled 100.000 times by the value of each deme in the suitability map. Quite smart!
- It really helps me constraining (guiding) the demographic history.
If you ever played John Conway’s Game of Life, you know how far can random walkers go… Suitability maps have been used to inform friction maps to constrain movements in the landscape. Demes with high friction coefficients discourage the random walkers to go through them.
- It’s a cheap way to time travel (we love cheap): it helps us to build some formal sense of the past species distribution dynamics. Using high resolution paleoclimatic reconstructions like CHELSA-Trace21k you can even extrapolate the habitat suitability to the Last Glacial Maximum!
 suspicious? You can always test the robustness of your analysis to these reconstructions!
  )
)
 - Another D liiike … D-emographic!
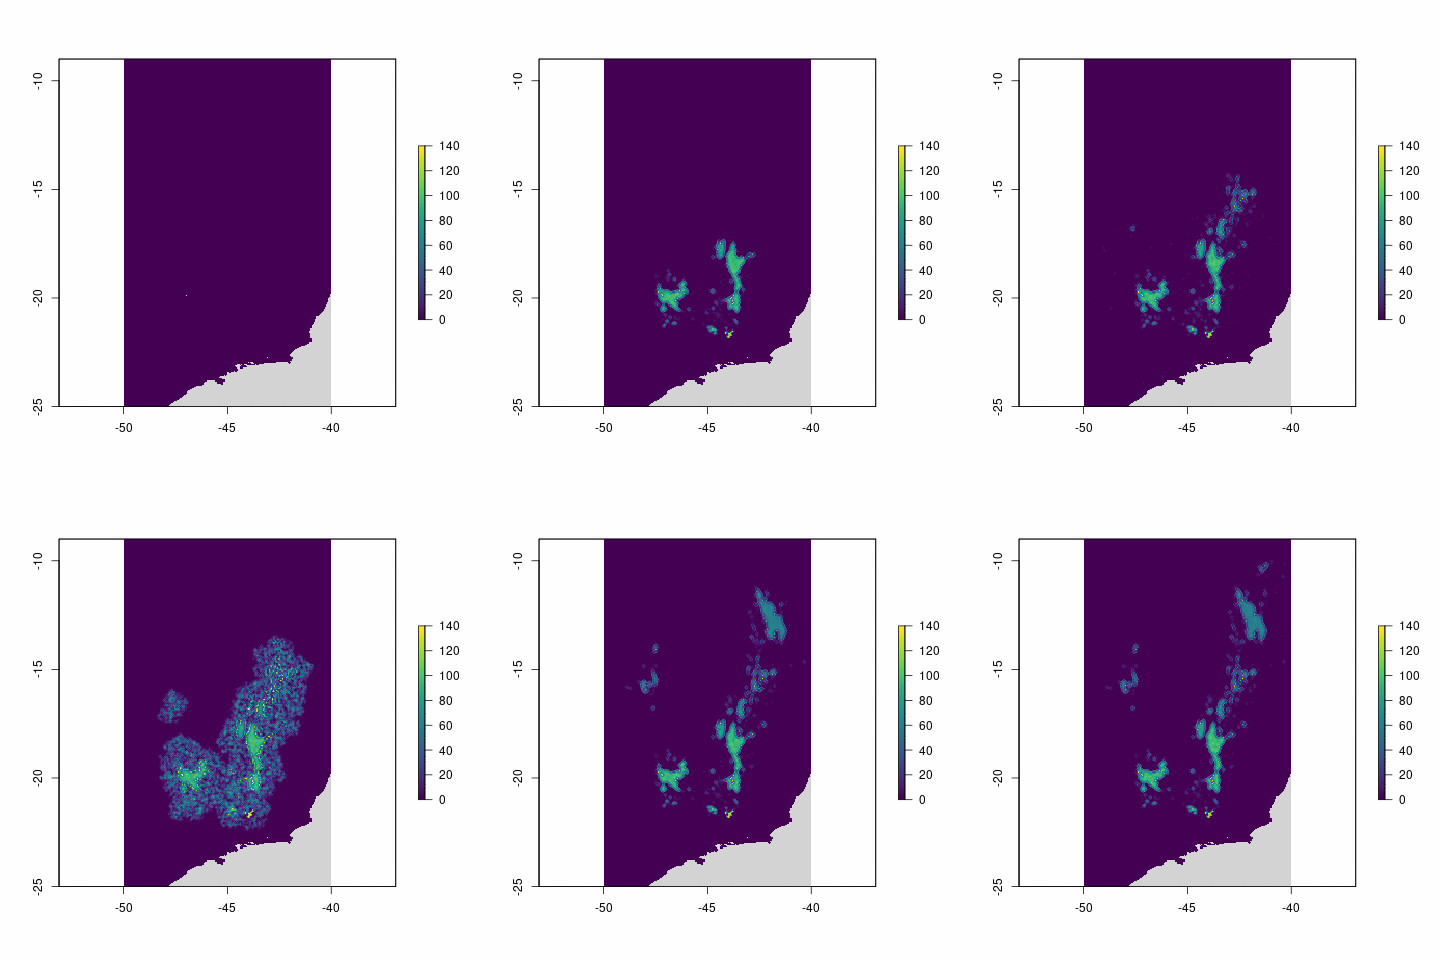
A hypothetical species colonizing campos rupestres despite climatic pulses. Color level: local population size.
Simulated and animated with Quetzal-CRUMBS
At phylogeographic scales, it’s not really feasible to simulate individuals and their genetics from the past to the present. That would be way too slow. Instead, I proceed in two steps:
- A time-forward, simplified demographic simulation
- A time-backward simulation of the sampled lineages dynamics in this demographic simulation
![]() The demographic simulation step is the best moment for me to inject some custom flavor into the iDDC recipe, resulting in a closer match to my biological system: even at these scales, a snail is still quite different from an owl, a fox or a starflower- and acts as such.
The demographic simulation step is the best moment for me to inject some custom flavor into the iDDC recipe, resulting in a closer match to my biological system: even at these scales, a snail is still quite different from an owl, a fox or a starflower- and acts as such.
 - C liiike … C-oalescence!
Ahlala, coalescence: the nightmare of every grad student. It took me a PhD and countless sleepless nights to understand maybe 1% of this theory (but it took me only one second to decide it was the work of mathematicians to understand the remaining 99%).
Fundamentally, it’s just a way to represent the dynamics of lineages in a population. Concretely, the fact that the theory describes this dynamics backward in time can be freaking confusing ![]()
But it is actually very elegant, and super efficient in terms of simulation. You just start with the lineages from your sample, and you ask the question of where these lineages could have been one generation before.
- Since you just run a demographic simulation, you can use the effective migration flows to inform this probabilistic process: that’s the backward migration of lineages.
- Sometimes some lineages will coalesce: that means your sample just found a possible common ancestor.
![]() Again, it’s a probabilistic model: maybe that this common ancestor does not really reflect your data, maybe the migration patterns are way off, and so maybe this demographic simulation is not the best candidate and should be discarded. Rejection of bad simulations is a key aspect of simulation-based inference.
Again, it’s a probabilistic model: maybe that this common ancestor does not really reflect your data, maybe the migration patterns are way off, and so maybe this demographic simulation is not the best candidate and should be discarded. Rejection of bad simulations is a key aspect of simulation-based inference.
 My mission - to democratize iDDC modeling!
My contribution to iDDC: a big bunch of softwares!
![]()
![]() In the same way that you don’t use a scooter to fly
to the moon, you have to come up with a pretty good engine if you want to look back at the
spatial dynamics of a species over thousands of years.
In the same way that you don’t use a scooter to fly
to the moon, you have to come up with a pretty good engine if you want to look back at the
spatial dynamics of a species over thousands of years.
The problem is, until recently we did not really have an iDDC engine ![]() We had some blueprints, some general guidelines from previous research, and Splatche, a 20 years old blackbox simulator. Even if it has been super useful, the fact this software is not open source put an end to many attempt to push the field further
We had some blueprints, some general guidelines from previous research, and Splatche, a 20 years old blackbox simulator. Even if it has been super useful, the fact this software is not open source put an end to many attempt to push the field further ![]()
When I began my PhD, my situation was a bit equivalent to trying to retro-engineer Apollo 11 when all you have is a blurry photography of the launch: no engineer, no toolbox, no components, no raw materials either, no industry, no factory. With no tools to push the limits of science, no wonder why iDDC stagnated for so long! ![]()
So I decided to build these tools and components ![]() It was a fun experience, because you end up trying to convince people they need to buy your bricks if they are to build a nice house, when everybody is used to live in a rock-cut cave!
It was a fun experience, because you end up trying to convince people they need to buy your bricks if they are to build a nice house, when everybody is used to live in a rock-cut cave! ![]()
![]() But with the infinite trust and patience of my successive PIs, and following the advice of some of the most outstanding developers you can find, I ended up designing the Quetzal framework: a suite of softwares with increasing granularity that together offer a flexible modeling/simulation/inference capability!
But with the infinite trust and patience of my successive PIs, and following the advice of some of the most outstanding developers you can find, I ended up designing the Quetzal framework: a suite of softwares with increasing granularity that together offer a flexible modeling/simulation/inference capability!
When 8 years ago we had almost nothing for iDDC modeling, we have now:
- Quetzal-CoaTL: a C++ library with reusable components to build iDDC simulators
- Quetal-EGGS: a growing list of iDDC simulators
- Quetzal-CRUMBS: a python library that wraps most of the iDDC steps (paleoclimatic & observational data access, geospatial operations, easy SDM, ABC sampling, and visualizations!)
- Quetzal-NEST: a Docker container that contains all the numerous dependencies for reproducible research: you can even use it to easily run Quetzal simulations on clusters (e.g., Open Science Grid).
- Decrypt: an iDDC-based tool for helping species diagnostics (basically an automated robustness analysis of the Multi-Species Coalescent model).
What’s next?
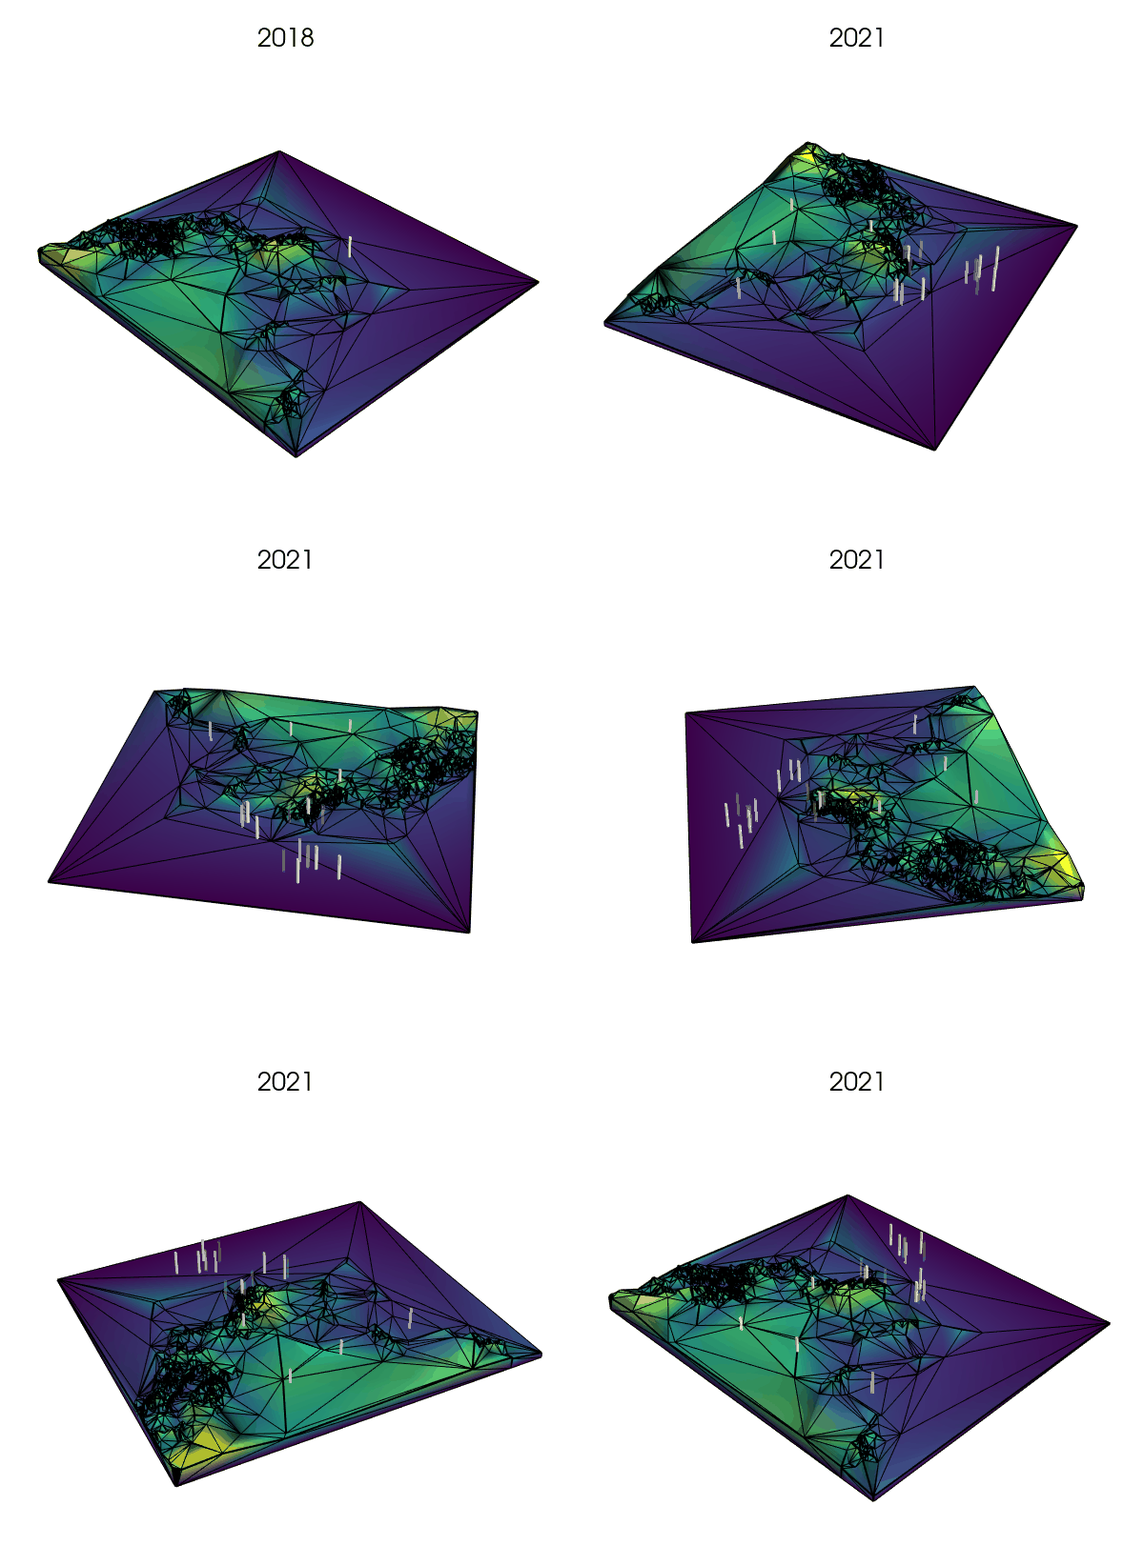
Simplifying the landscape with Delaunay trianguations: a next step?
Simulated and animated with Quetzal-CRUMBS
![]() First, I want to finish consolidating these resources, and expand their documentation, so that the many people who showed interest in my work can actually use it! It takes time because it’s a whole framework that needs to hold together!
First, I want to finish consolidating these resources, and expand their documentation, so that the many people who showed interest in my work can actually use it! It takes time because it’s a whole framework that needs to hold together!
![]() I’m applying this framework to the study of Heteronotia binoei, an Australian gecko. Making sure I can shove this dataset all the way through Quetzal will ensure that future users will not get stuck in a pipe!
I’m applying this framework to the study of Heteronotia binoei, an Australian gecko. Making sure I can shove this dataset all the way through Quetzal will ensure that future users will not get stuck in a pipe! ![]()
![]() We need more EGGS! If the iDDC community can come together to discuss what models should be designed and for what data, that could expand the list of available simulators and push the iDDC field forward! That will take a village!
We need more EGGS! If the iDDC community can come together to discuss what models should be designed and for what data, that could expand the list of available simulators and push the iDDC field forward! That will take a village! ![]()
![]()
![]()
![]() A quite expected issue concerns the volume of data that the simulations will need to handle. There are many ideas I would like to test, for example:
A quite expected issue concerns the volume of data that the simulations will need to handle. There are many ideas I would like to test, for example:
- using VRT (GDAL Vitual Format) to represent large and complex geospatial datasets and transformations
- using Voronoi tesselations to approximate the landscape where fine resolution is not needed, but increasing the number of cells where key processes are expected to happen (e.g., small rock formations in a desert or on a glacier, or narrow straits between larger bodies of water).
- Engage a discussion with climate scientists about multi-scale modeling: they would obviously know better than I do if and how we could reuse some of their tools/concepts to tackle the many scales of phylogeographic questions!
 References
-
Knowles, L. L. (2009). Statistical phylogeography. Annual Review of Ecology, Evolution, and Systematics, 40, 593-612
-
Larsson, D. J., Pan, D., & Schneeweiss, G. M. (2021). Addressing alpine plant phylogeography using integrative distributional, demographic and coalescent modeling. Alpine Botany, 1-15.
